
Credit Spread Metrics That Matter: ROC, Max Risk, Duration
Credit is the easy number. Return on capital, max risk, and duration are what make two 40-cent credits incomparable. How CoveredLoop puts them on the structure card.
By CoveredLoop
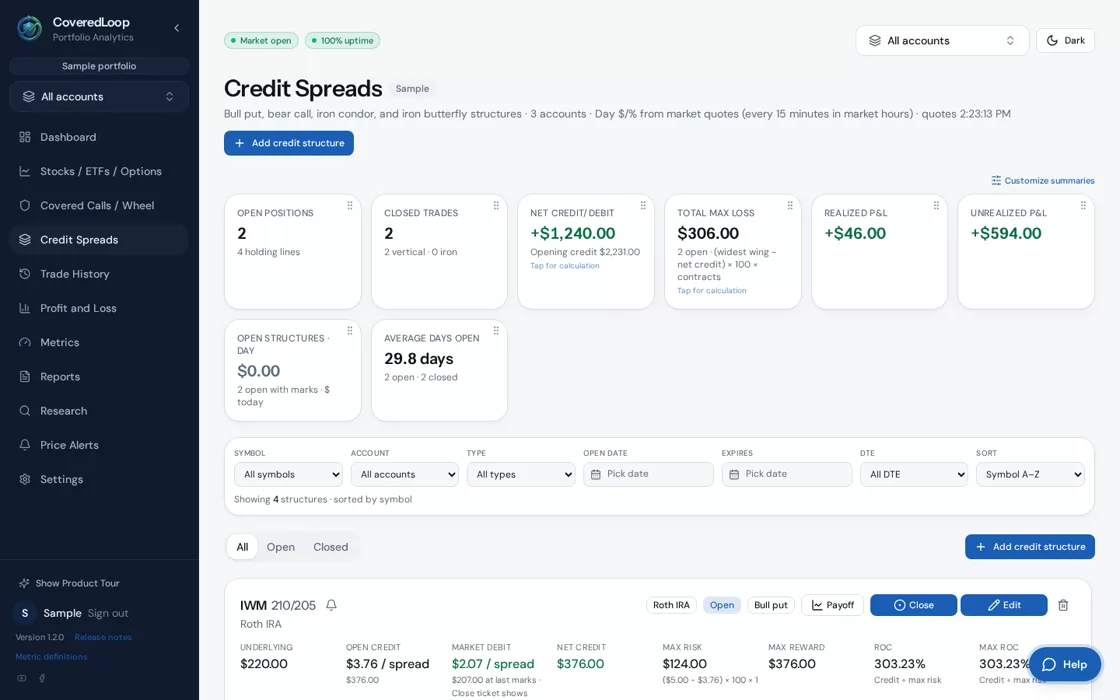
A vertical spread is two (or four) legs that only make sense together. If your tool shows four one-off options, you cannot see credit, max risk, or return on capital without a side sheet. CoveredLoop’s credit-spread workspace is built for defined-risk structures: bull put, bear call, iron condor, iron butterfly.
This is a metrics note, not a pitch to sell spreads. Defined risk is not no risk. Early assignment and gap opens still exist. See the risk disclosures.
Credit is not the ranking key
Two trades can take the same credit and be nothing alike. A tight put spread and a wide one that both take 0.40 are different capital, different max loss, and often different holding periods. Return on capital against the margin or cash the spread actually ties up is the number that changes behavior. Max risk is the other side of that fraction. Duration keeps a 10-day trade from being compared to a 45-day trade as if they were the same holding period.
CoveredLoop puts credit, max risk, max reward, ROC, duration, realized P&L, unrealized P&L, and leg-level marks on the card. Sort and filter without losing the pairing of short and long strikes.
Condors and butterflies are one structure
An iron condor is not two unrelated verticals that happen to share an expiration. Closing one side, rolling a wing, or taking the untested side off should still be visible on the original card. If you split a wing into the wrong bucket, recategorize it. That is cheaper than deleting a four-leg trade and keying it again.
The same cleanup language exists on covered calls so the book does not have two different ideas of “this lot belongs over there.”
How the metrics roll up
Structure metrics feed the dashboard and Profit and Loss: charts, distribution by trade type, and the account-balance rollforward. If credit-spread P&L on the summary tiles does not match a naive “option P&L” in a brokerage app, it is often because the brokerage is not grouping the wings.
Metrics suite numbers — win rate, profit factor, expectancy, and the rest — honor the same account filter. Reviewing only bull puts in one IRA is a filter, not a new export.
Research, then Sample
The research tools can screen credit-spread ideas, open a chain, and run what-if before anything is a fill. Add the setup to Sample and you get the same credit / max risk / ROC fields live trades get. That is the point of Sample: learn the card on realistic structures without connecting a broker.
Related: Tradier vs manual, covered-call P&L, What We Offer, pricing.